accomplice | wrapped
| wrap-ups | accomplice | guests: caleb zane huett, tomas gimenez rioja | 1337 Words
note: i’m writing this in february 2025 because i didn’t get into the habit of writing wrap-up posts until later in the show & now i love doing them so much that i want to fill in the backlog
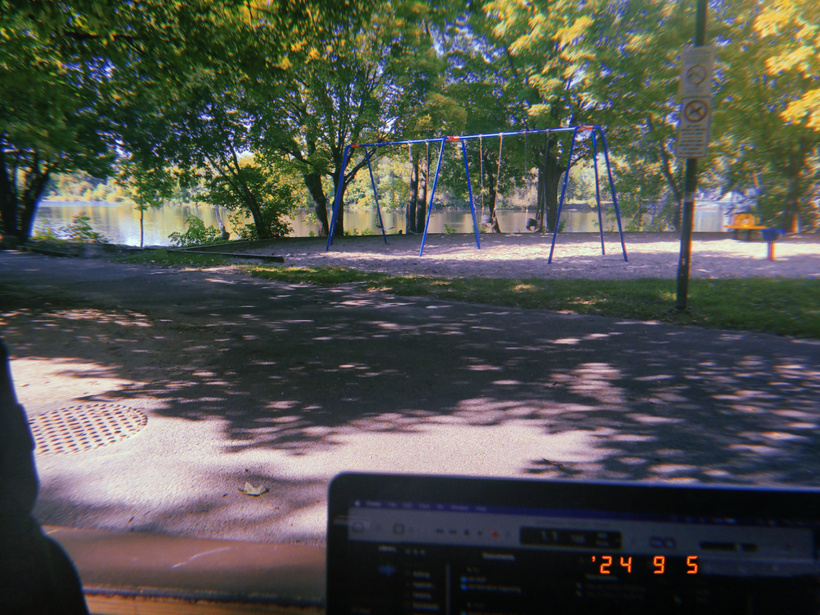
the very first series of the podcast featured the game accomplice🖤 it was posted a little bit sooner than i originally expected because i realised that i really wanted it to be out in full by hallowe’en. the three playthroughs were recorded in july & september of 2024, which means it was still weather where i could remember that laptops are like very portable & edit in parks sometimes:
the guests
tomas gimenez rioja | @TGimenezrGM [ bluesky | twitter | instagram]
get notified of the launch of magnolia: city of marvels, a systemless setting of art, punk, & rebellion at https://www.tomasgimenezrioja.com/magnolia-city-of-marvels
caleb zane huett | hauntedtable.games | calebzanehuett.com
order a physical copy of triangle agency at shop.hauntedtable.games or hauntedtable.itch.io
charts & process
i wasn’t consistently tracking my post-production hours yet, so i’m not sure how long these episodes took to put together, but i know it was definitely a hefty chunk of time!! unsurprisingly, there was a lot of stumbling as i tried to figure out in real time what the show would, like… be?
as a specific example that is still very funny to me: i did a “previously-on” for the second episode, which– as i openly threaten would likely be the case in the episode itself– has never happened again. i love the idea of having one but found it SHOCKINGLY time-consuming to do, so it’s just not something i can prioritise unless the show somehow starts… like… paying my rent..? you know how it is with Value-Adding Yet Extraneous Tasks
ok. i’m going to throw a lot of charts at you now. like a lot. you can look at the data if you want to do your own stuff with it, but i will warn you that this spreadsheet is particularly messy. there are just a lot of moving parts. sometimes this will happen when you’re getting a little silly with it. let’s go.
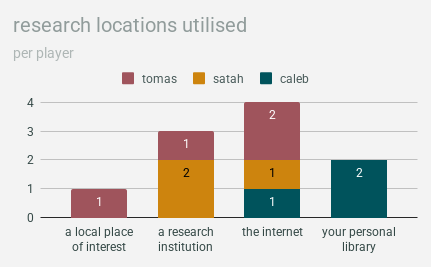
rounds
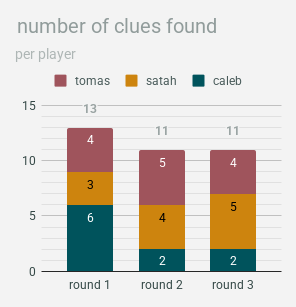
each round of research ended up providing about the same number of clues in total, though caleb’s results were definitely front-loaded (note: in this instance, i’m counting the two middle rounds of tomas’ research both as “round two”):
clues
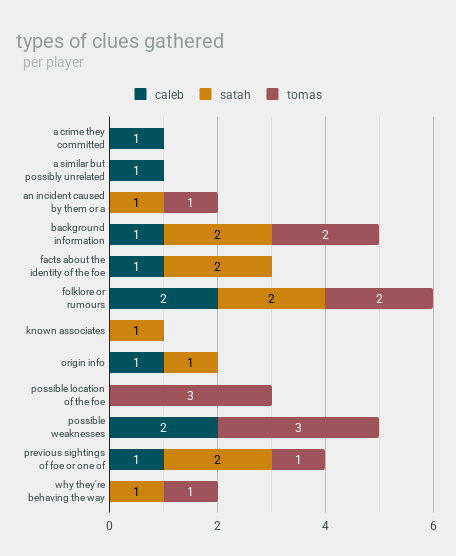
our investigation into our foes was, of course, influenced by what kinds of details our research turned up.
- all three of us found
- background information
- folklore or rumours
- previous sightings of the foe or one of their ancestors
- the most common type of clues were
- folklore or rumours (six)
- background information AND possible weaknesses (five each)
- previous sightings of foe or one of their ancestors (four)
- the majority of types of clues appeared in multiple games, but some types of clues were only found by one person:
- we all had at least one exclusive clue type
- caleb had the highest number of exclusive clue types (two types)
- tomas found the highest volume of his exclusive clue type (three clues)
also: there are thirteen possible clues in total, & we only got twelve of them 👀
research locations
the only research location that we all used was the internet, which is realistic in a very funny way. i love that the more academic characters (tomas’ librarian & my curator) both visited a research institution, while the character who was set up to rely more on personal history & experience was the only one who used their own library. that worked out in a cool way!!
on the topic of realistic depictions of the internet, here’s a statistic i decided to call “location efficacy” that made me laugh out loud the first time i put it it together:
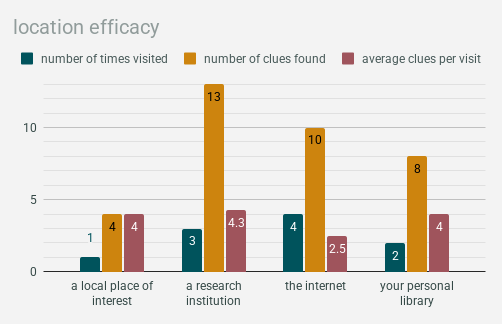
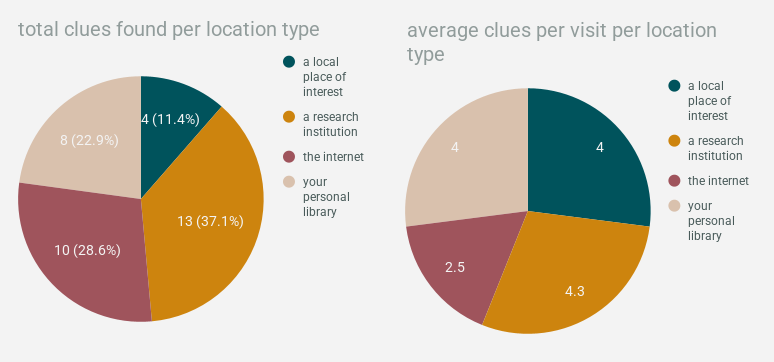
the internet was visited the most times & provided the second-highest number of clues in total, but was by far the least effective method of research, with only an average of 2.5 clues per visit. the other three were pretty close together. research institutions technically come out on top at an average of 4.3 clues per visit, but libraries & local places of interest are just barely behind with an average of 4.
perhaps technically the sample sizes here are so small that this essentially means nothing, but it, like…… definitely feels true vis a vis where the internet is at the past few years, right…..? the one thing the internet COULD basically keep up with was breadth of information, which we can determine by looking at how many different types of clues were found at each location
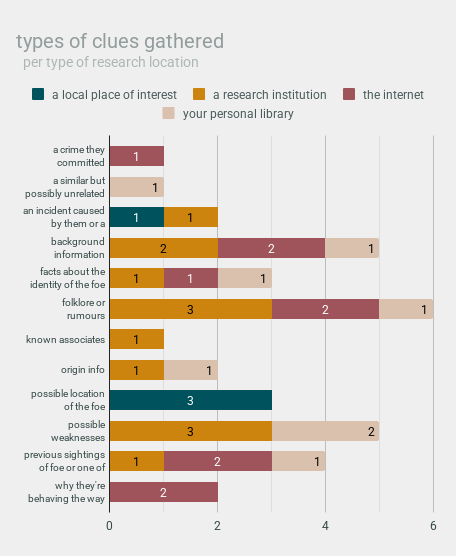
obviously, here we can see that:
- widening your sources is important!
- no type of clue was found at every single research location
- research institutions provided eight different types of clues
- personal libraries provided seven different types of clues
- the internet provided six different types of clues
- local places of interest provided two different types of clues
- if you want to find [x], do your research at [y]:
- crimes committed OR why the foe is behaving the way they are -> the internet
- similar but possibly related incidents -> your personal library
- known associates -> a research institution
- possible locations of the foe -> a local place of interest
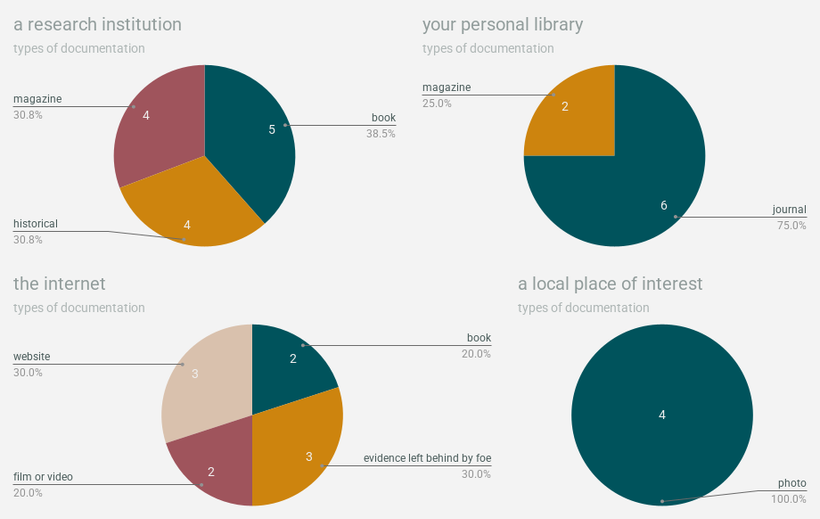
documentation
the type of documentation you’re doing research with (like a newspaper or a book) is determined by the value of the card that also determines where you’re researching (like a research building or the internet), so the general uniformity of the results here isn’t surprising.
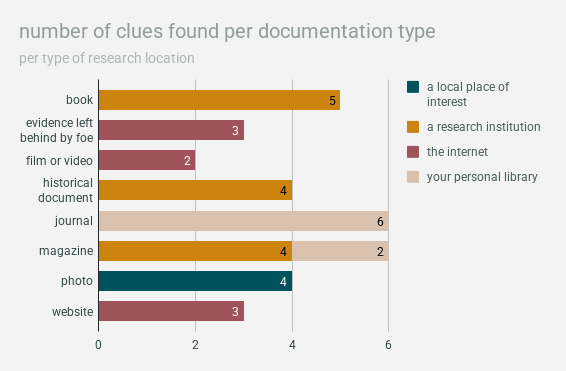
i still thought it was fun to see things like:
- the most information comes from journals from your personal library and books from research institutions
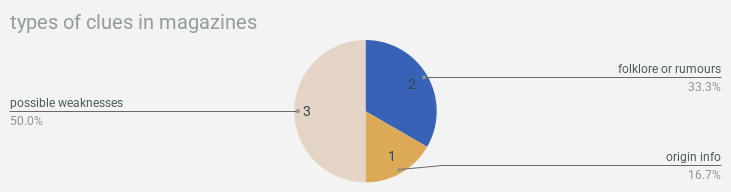
- a magazine from a research institution is more fruitful than a magazine from your personal library
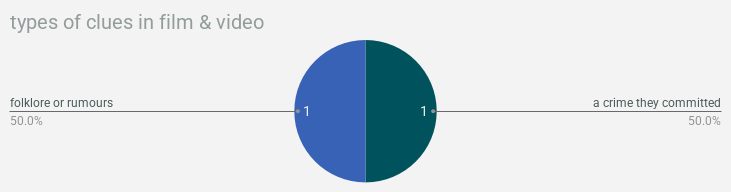
- film/video from the internet is ultimately the least helpful
this doesn’t even come close to measuring how impactful the clue was on the narrative, of course (particularly the videos from the internet, in caleb’s case), so if you figure out a way to quantify that in a spreadsheet, please do let me know 👨🔬
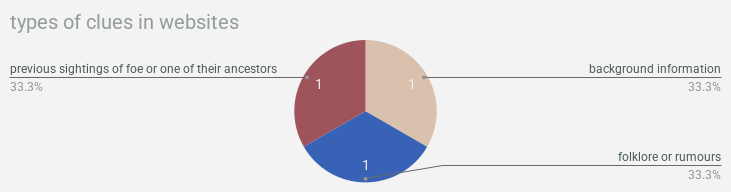
the types of documentation found at specific research locations also ended up pretty apt! mechanically, there’s no reason you couldn’t have “a website from/related to a local place of interest”, but all of our websites ended up being from the internet. which is totally where websites tend to live!!!!!!!!!!!
because tomas technically did one more round than caleb and i, he has a slightly broader spread of documentation types. his character was slightly luckier at getting information out of magazines than caleb’s, but less lucky at getting information out of books than my character (bit of a librarian L there i’m afraid; sorry buddy). overall, books, journals, and magazines were the most fruitful types of documentation– shout out to the printed word 📚
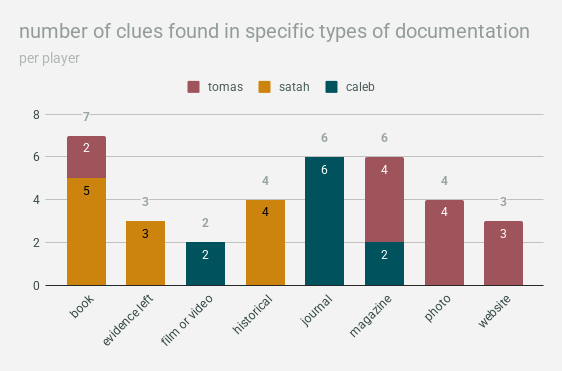
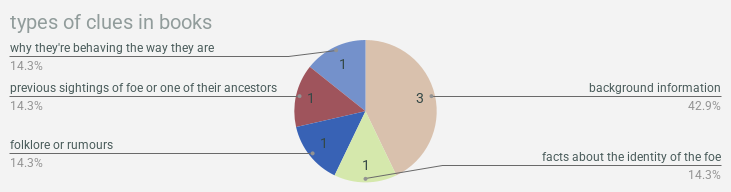
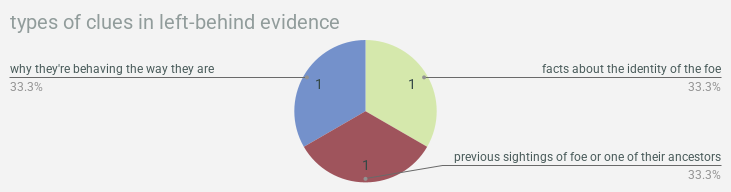
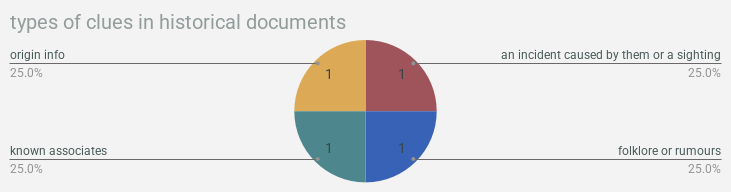
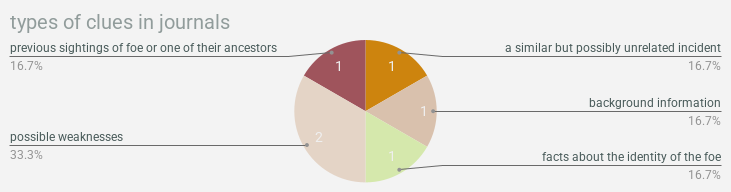
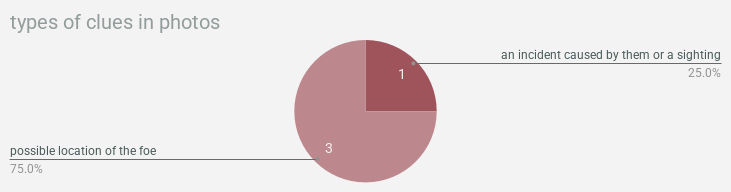
& now we’re gonna wrap up with a bunch of pie charts showing what types of clues were found in what types of documentation!!! so much to learn here!!!!!!!!! you want to find background information? crack a freaken book. you want weaknesses? check out a magazine or journal. you can find clues about locations in pictures!!!!!!! this is all real data about real life, i think actually, is what i’ve decided! use this as a guide for actual real genuine research you’re doing!!! we will not lead you astray!!!!!!!!!!
alright that’s it
i remain deeply grateful to caleb & tomas for helping me craft this first series. the diverging tones & narratives immediately showed me that my concept was actually going to work & their stories being so good was one of the things that gave me the confidence to actually start getting it out there. this game will always be immensely special to me & it was really really fun to go back & revisit some parts of it to indulge in a little bit of my charts insanity.
thanks & happy valentine’s day LMFAOOO incredible day for me to finish this up🖤